

Inflation in Uzbekistan decreased to 6.2% in August
The National Statistical Committee reported that annual inflation in Uzbekistan slowed to 6.2% in August 2026, with a monthly price increase of 0.2%.
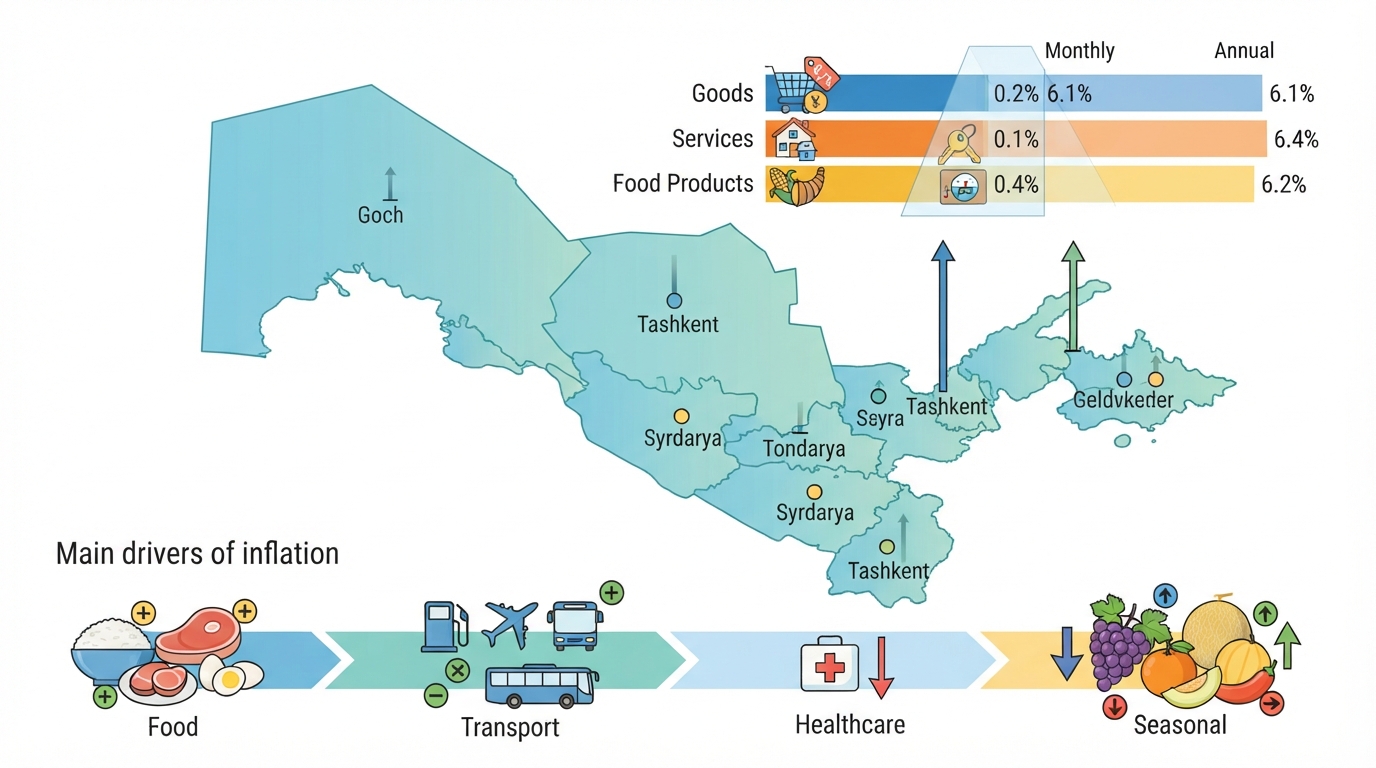
Inflation in Uzbekistan fell to 6.2% in August
The consolidated consumer price index in Uzbekistan in August 2026 increased by 0.2% over the month, by 3.4% since the beginning of the year, and in annual terms, inflation stood at 6.2%, down from 8.8% a year earlier. Excluding fruit and vegetable products, the monthly price growth also amounted to 0.2%, with a 4.9% increase since the beginning of the year, and an annual rate of 6.6% compared to 9.6% in August 2025. This was reported by the National Committee of the Republic of Uzbekistan on Statistics.
Prices for goods rose by 0.3% over the month (up 3.0% since the beginning of the year, and 6.1% year-on-year), including food products by 0.4% (1.9% and 6.2% respectively), and non-food products by 0.2% (4.3% and 5.9%). Services became 0.1% more expensive over the month, rising by 4.7% since the beginning of the year, and by 6.4% in annual terms, which is significantly lower than last year's 16.2%.
The largest contribution to the monthly increase in the consolidated index was made by the "Food and non-alcoholic beverages" section — plus 0.16 percentage points, followed by "Transport" — plus 0.04 p.p. Price decreases in the "Healthcare" section held back the index growth by 0.01 p.p. The combined contribution of the remaining sections amounted to 0.05 p.p. The total impact of all sections over the month reached 0.24 p.p.
Since the beginning of the year, the largest contributions to the growth of the consolidated index were made by the sections "Housing services, water, electricity, gas and other fuels" (1.14 p.p.), "Food and non-alcoholic beverages" (0.67 p.p.), and "Transport" (0.52 p.p.) — totaling 2.33 p.p., or 68.3% of the total impact. The contribution of the remaining sections amounted to 1.08 p.p., or 31.7%. The total impact of all sections since the beginning of the year was 3.41 p.p.
Among food products, prices for rice and broken rice rose by 2.2% over the month (while decreasing by 4.1% year-on-year), buckwheat by 1.1% (+8.1% year-on-year), eggs by 0.8% (+12.8% year-on-year), flour by 0.5% (+5.9% year-on-year), mutton by 0.7% (+20.0% year-on-year), boneless beef by 0.7% (+18.8% year-on-year), bone-in beef by 0.4% (+16.2% year-on-year), and chicken drumsticks and thighs by 0.7% (+1.2% year-on-year). Prices decreased for granulated sugar by 0.6% (+1.6% year-on-year), milk by an average of 0.3% (+5.0% year-on-year), and cottonseed oil by 0.1% (+6.2% year-on-year).
The seasonal factor determined the price dynamics of fruit and vegetable products. Over the month, prices decreased for grapes by 10.9% (−2.0% year-on-year), bell peppers by 9.2% (+9.8% year-on-year), apples by 7.2% (+9.1% year-on-year), pears by 6.0% (−13.3% year-on-year), eggplants by 5.5% (−31.8% year-on-year), cabbage by 4.9% (−3.8% year-on-year), and potatoes by 3.3% (−15.2% year-on-year). Prices increased for carrots by 9.2% (−2.3% year-on-year), watermelons by 7.5% (−11.2% year-on-year), onions by 6.2% (−9.2% year-on-year), and citrus fruits by 1.6% (+9.2% year-on-year).
Tariffs for the main types of communal services did not change in August. Actual rent for housing rose by 0.4% (+4.2% year-on-year), and services for the maintenance, repair, and security of residential premises became 0.3% more expensive (+5.8% year-on-year).
The observed types of medicines became cheaper by an average of 0.2% (+2.3% year-on-year), immunization services by 0.2% (+2.8% year-on-year), and auxiliary vision products by 0.6% (+1.2% year-on-year).
The average price level for gasoline increased by 1.9% over the month (+20.2% year-on-year). AI-92 grade gasoline rose in price by 1.1%, AI-95 by 4.9%, and AI-98 and AI-100 by 6.7%. Propane became 5.8% more expensive (+41.4% year-on-year), while methane prices remained at the July level (+10.3% year-on-year). According to the methodology of the National Committee on Statistics, data from the tax authorities' database for the period from August 1 to August 25 was used to calculate average prices for gasoline and gas fuel: 21,753 price quotes across 898 facilities for gasoline, 5,825 quotes across 383 facilities for propane, and 10,554 quotes across 566 facilities for methane. The price per liter of AI-92 gasoline ranged from 10,500 to 16,400 soums, AI-95 from 12,500 to 20,000 soums, and AI-98 and AI-100 from 16,000 to 28,000 soums. The upper price limit for propane reached 8,800 soums per liter.
Among passenger transport services, an increase in tariffs was noted for domestic flights — by 0.1% over the month, and for international flights — by 1.7%, which is linked to rising fuel costs and fluctuations in the exchange rate of the euro against the soum. Fares for intercity buses increased in the Surkhandarya, Jizzakh, and Navoiy regions, as well as in Tashkent. On average across the republic, intercity road passenger transport became 0.6% more expensive (+7.3% year-on-year).
In the field of education, prices rose for attending private preschool educational organizations by 0.3% (+3.2% year-on-year), tutoring by 0.2% (+5.0% year-on-year), and language courses by 0.1% (+4.4% year-on-year).
In the "Insurance and financial services" section, the short-term index fell below the 100% mark to 99.8%. Fees for money transfers in August were 1.4% lower than a month earlier, influenced by the strengthening of the soum against the US dollar and the Russian ruble. At the same time, since the beginning of the year, the section's index has grown by 43.7%, and in annual terms by 43.0%, remaining the highest indicator among all sections of the CCPI.
Full dynamics for the remaining sections of the CCPI of the Republic of Uzbekistan 2018 (compared to July 2026 / compared to December 2025 / compared to August 2025): "Alcoholic beverages and tobacco products" — 100.6% / 104.9% / 106.7%; "Clothing and footwear" — 100.1% / 101.7% / 103.0%; "Household items, home appliances, and routine housing maintenance" — 100.1% / 102.1% / 102.7%; "Information and communication" — 99.9% / 102.6% / 105.9%; "Recreation, sport, and culture" — 100.2% / 102.4% / 103.5%; "Restaurants and hotel services" — 100.3% / 105.3% / 107.2%; "Personal care goods and services, miscellaneous goods and services" — 100.2% / 104.5% / 106.6%.
In the regional breakdown, no significant deviations from the national average were recorded in either the short-term or annual index. Annual inflation by region (compared to August 2025) was distributed as follows: Republic of Karakalpakstan — 6.2%, Andijan region — 6.5%, Bukhara — 5.7%, Jizzakh — 6.3%, Kashkadarya — 6.3%, Navoiy — 6.2%, Namangan — 6.1%, Samarkand — 6.3%, Surkhandarya — 5.7%, Syrdarya — 5.2%, Tashkent region — 6.1%, Fergana — 6.6%, Khorezm — 6.4%, Tashkent city — 6.8%. The lowest annual price growth was recorded in the Syrdarya region, and the highest in the capital.