

In Uzbekistan, the export of services has become the largest source of revenue due to tourism
Uzbekistan's exports, excluding gold, increased by 27.7% in January-July, but overall exports decreased due to a decline in gold deliveries. At the same time, imports increased by nearly 18%, mainly driven by machinery, food, and chemical products. Tourism services exports approached $4 billion.
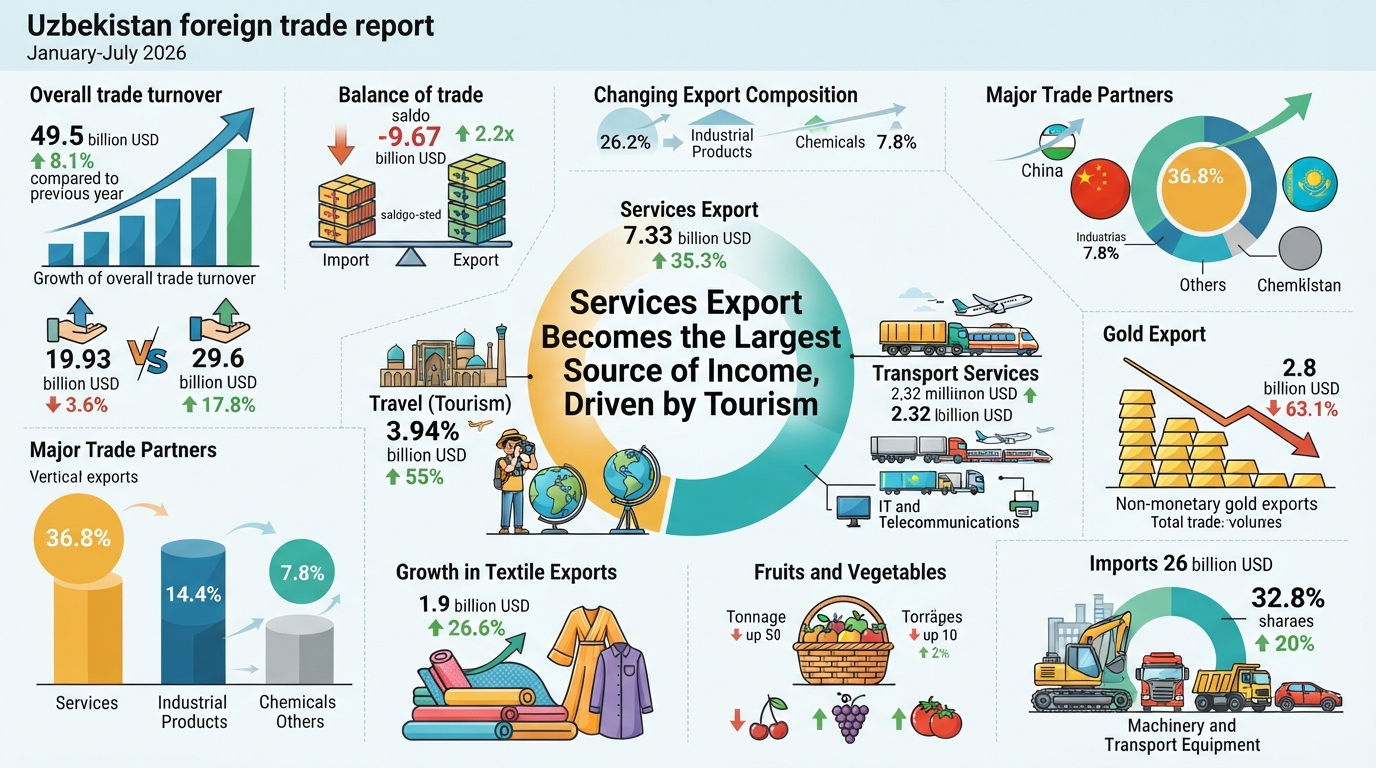
In Uzbekistan, services export has become the largest source of revenue due to tourism
In January–July 2026, the foreign trade turnover of Uzbekistan amounted to 49.5 billion dollars, increasing by 8.1 percent compared to the corresponding period of last year.
Exports decreased by 3.6 percent to 19.93 billion dollars, while imports increased by 17.8 percent to reach 29.6 billion dollars. As a result, the negative balance in foreign trade rose from last year's 4.44 billion dollars to 9.67 billion dollars, which means it increased by almost 2.2 times.
At the same time, excluding gold, the export of goods amounted to 9.8 billion dollars, increasing by 27.7 percent on an annual basis.
China remains Uzbekistan's largest trading partner: the volume of trade with it increased by 33.6 percent in seven months, reaching 11.26 billion dollars from last year's 8.43 billion dollars. Next in line are Russia — 8.13 billion dollars (+11.8%) and Kazakhstan — 3.27 billion dollars (+24%). China accounted for 22.7 percent of the country's total foreign trade turnover, Russia — 16.4 percent, and Kazakhstan — 6.6 percent.
One of the main factors in the decline of total exports remains the reduction in the volume of non-monetary gold deliveries.
In January–July, Uzbekistan exported gold worth 2.8 billion dollars. In the corresponding period of 2025, this figure was 7.59 billion dollars. Thus, the volume decreased by 63.1 percent or almost 2.7 times.
The share of gold in total exports fell from 36.7 percent to 14.1 percent.
Against this background, the structure of exports also continued to change. The share of services increased from 26.2 percent to 36.8 percent (it was 24.1% last year), industrial products — from 11.3 percent to 14.4 percent, chemical products — from 5.6 percent to 7.8 percent, and various manufactured articles — from 4.3 percent to 8.4 percent.
According to the results of seven months, the largest component of exports was services.
Their volume increased by 35.3 percent, reaching 7.33 billion dollars from 5.42 billion dollars. More than half of services exports — 53.8 percent or 3.94 billion dollars — was accounted for by travel (tourism). This indicator grew by 55 percent compared to the corresponding period of last year (2.5 billion dollars).
Transport services amounted to 2.32 billion dollars (31.7%), telecommunications, computer, and information services — 622 million dollars (8.5%), and other business services — 209.5 million dollars (2.9%).
The export of industrial products increased by 22.4 percent, reaching 2.87 billion dollars. In this group, the volume of deliveries of textile yarn, fabrics, and finished products reached 1.15 billion dollars (+26.3%), non-ferrous metals — 1.04 billion dollars (+7.8%), and products made from non-metallic minerals — 207.7 million dollars (+29.7%). The export of cast iron and steel increased almost twofold, reaching 185.1 million dollars (+91.5%).
The export of various manufactured articles increased by 89.1 percent, reaching 1.68 billion dollars from 890.4 million dollars. In particular, the delivery of clothing and clothing accessories increased by 30 percent, amounting to 752.3 million dollars. The export of manufactured articles not elsewhere classified increased by 3.2 times, reaching 868.4 million dollars.
Deliveries of machinery and transport equipment increased by 34.9 percent, amounting to 757.2 million dollars. The export of other transport equipment reached 115.7 million dollars and grew by 59.6 percent, power-generating machinery — 119.4 million dollars (+38.9%), and telecommunications and sound recording apparatus — 61.6 million dollars (3.2 times). At the same time, the export of road vehicles decreased by 2.2 percent, amounting to 157.2 million dollars.
The export of chemicals and related products increased by 35 percent, reaching 1.56 billion dollars.
The main part consisted of inorganic chemicals — 944.8 million dollars (+47.2%). The export of fertilizers increased by 1.4 percent to 255.3 million dollars, and the export of plastics in primary forms increased by 25.2 percent to reach 167.8 million dollars. Medical and pharmaceutical products were exported for 39.7 million dollars (+53.6%).
The export of food products and live animals amounted to 1.54 billion dollars, increasing by 2.3 percent. Their share in total exports rose from 7.3 percent to 7.7 percent.
In January–July, Uzbekistan exported 1.284 million tons of fruit and vegetable products. This is 5.5 thousand tons or 0.4 percent more than last year.
At the same time, in monetary terms, exports decreased by 3.9 percent — from 1.067 billion dollars to 1.025 billion dollars. Fruit and vegetable products accounted for 5.1 percent of total exports.
The export of fruits in monetary terms decreased from 330.8 million dollars to 308 million dollars (−6.9%), and in physical terms from 290.8 thousand tons to 251 thousand tons (−13.7%).
Deliveries of cherries fell from 72.5 million dollars to 59.9 million dollars (−17.4%), apricots — from 46.7 million dollars to 32.4 million dollars (−30.6%), and dried grapes — from 73.3 million dollars to 62.1 million dollars (−15.3%).
At the same time, the export of peaches increased from 80.5 million dollars to 91.7 million dollars (+13.9%), and grapes — from 24.9 million dollars to 28.9 million dollars (+16.1%).
The export of vegetables, on the contrary, increased from 165.9 million dollars to 200.5 million dollars (+20.9%). Deliveries of onions increased to 89.3 million dollars (+12%), cabbage — to 54.7 million dollars (+12.3%), tomatoes — to 34.4 million dollars (+38.7%), and carrots — to 13.1 million dollars (+63.7%).
The export of melons and watermelons amounted to 55.1 million dollars, increasing by 31.5 percent.
According to the results of seven months, the export of textile products reached 1.9 billion dollars — this is 26.6 percent more than last year.
Textile products accounted for 9.5 percent of the total export volume. In the structure of deliveries, the main share was occupied by finished textile products — 52.2% and yarn — 31.4%.
The import of goods increased by 4.1 billion dollars to reach 26 billion dollars, while the import of services reached 3.6 billion dollars.
The largest component of imports remains machinery and transport equipment. The volume of their delivery increased by 20 percent, reaching 9.7 billion dollars, and their share in total imports increased from 32.2 percent to 32.8 percent.
The import of road vehicles and other transport equipment amounted to 2.4 billion dollars (+27.9%). In particular, the delivery of passenger motor cars and other motor vehicles principally designed for the transport of persons increased by 73.5 percent, reaching 920.4 million dollars. The import of motor vehicle parts and accessories increased by 10.9 percent, amounting to 1.09 billion dollars.
The import of electrical machinery and equipment increased by 38.1 percent to 1.59 billion dollars, and the import of power-generating machinery increased by 48.2 percent to reach 989.7 million dollars. Deliveries of telecommunications equipment increased by 87.5 percent, amounting to 1.01 billion dollars.
At the same time, the import of machinery specialized for particular industries decreased by 11 percent to 1.38 billion dollars, and the import of other transport equipment fell by 16.5 percent to 398.3 million dollars. In particular, deliveries of aircraft amounted to 202 million dollars, decreasing by 41.5 percent.
Among the major categories, the volume of deliveries of food products and live animals continued to grow at the highest rates.
In January–July, their import increased by 41.9 percent — from 2.32 billion dollars to 3.29 billion dollars. The share of food products in total imports rose from 9.2 percent to 11.1 percent.
The import of cereals and cereal preparations increased by 60.7 percent to 864.9 million dollars, meat and meat preparations — by 36.7 percent to 574 million dollars, and sugar, sugar preparations, and honey — by 51.2 percent to reach 434 million dollars.
Deliveries of vegetables and fruits increased by 31.9 percent to 352.8 million dollars, dairy products and birds' eggs — by 32.9 percent to 244.3 million dollars, and feeding stuff for animals — by 42.6 percent to reach 217.5 million dollars.
The import of chemical products increased by 15.6 percent, reaching 3.59 billion dollars. At the same time, deliveries of medical and pharmaceutical products decreased slightly — by 0.8 percent, amounting to 1.11 billion dollars, while the import of organic chemicals increased by 43 percent, amounting to 295.2 million dollars.
The import of mineral fuels, lubricants, and related materials increased by 10.7 percent, reaching 2.51 billion dollars.
In particular, the import of petroleum and petroleum products amounted to 1.34 billion dollars (+15.1%), and natural and manufactured gas — 1.01 billion dollars (+8.2%). The import of liquefied gas (propane) increased by 3.6 times, reaching 105.4 million dollars.
The import of gasoline in monetary terms increased by 60.8 percent, amounting to 426 million dollars. Deliveries of diesel fuel remained almost unchanged — increasing by 1.1 percent to reach 163.3 million dollars.
The import of electricity decreased by 17.9 percent, amounting to 55.8 million dollars. At the same time, its export increased by 30.3 percent, reaching 134 million dollars.
In seven months, the import of services amounted to 3.62 billion dollars, increasing by 13.3 percent. Travel (tourism) accounted for 43.6 percent of services imports or 1.58 billion dollars, and transport services — for 27.4 percent or 989.6 million dollars.
China remains the largest source of imports — it accounted for 9.56 billion dollars or 32.3 percent of the total import volume. Goods and services worth 5.3 billion dollars were imported from Russia, and 2.4 billion dollars from Kazakhstan. In general, Uzbekistan imported goods and services from more than 160 countries.