

Uzbekistan reduced gold exports by 4.3 times, but increased exports of services and industrial goods
Uzbekistan's exports in January-June decreased by 8.8% to $15.9 billion, while imports increased by 21% to $25.1 billion. The foreign trade deficit increased to $9.3 billion against a 4.3-fold decrease in gold exports. Imports of cars increased by 84.5%, and gasoline by 78.5%.
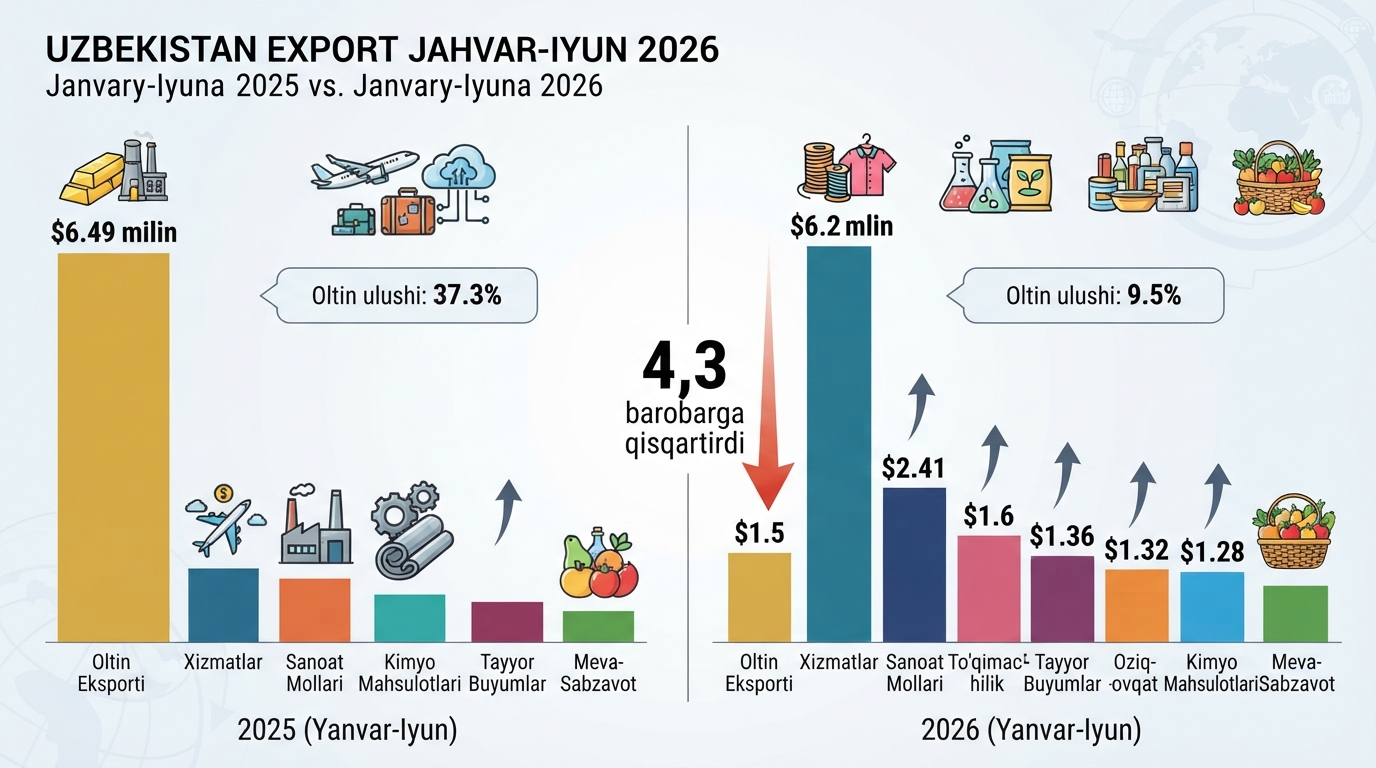
Uzbekistan reduced gold exports by 4.3 times, but increased exports of services and industrial products.
According to preliminary data from the National Statistics Committee, in January-June 2026, Uzbekistan's foreign trade turnover amounted to $41 billion, an increase of 7.4% compared to the same period last year.
Exports decreased by 8.8% to $15.86 billion, while imports increased by 21% to $25.15 billion. As a result, the negative indicator of the foreign trade balance reached $9.29 billion from $3.38 billion a year earlier, an increase of almost 2.7 times.
Excluding gold, exports of goods amounted to $8.2 billion, an increase of 28.7% year-on-year.
One of the main reasons for the overall decline in exports was a significant reduction in non-monetary gold supplies.
In January-June, Uzbekistan exported gold worth $1.5 billion, while in the same period of 2025 this figure amounted to $6.49 billion. Thus, the volume of gold exports decreased by 4.3 times.
The share of gold in total exports decreased from 37.3% to 9.5%.
At the same time, the composition of exports also changed: the share of services increased from 26.3% to 39.1%, industrial goods - from 11.3% to 15.2%, chemical products - from 5.6% to 8.1%, various finished goods - from 4% to 8.6%.
In January-June, the largest component of exports was services. Their volume increased by 35.7% - from $ 4.57 billion to $ 6.2 billion.
Services accounted for 39.1% of total exports. More than half of them - 52.9% - were travel (tourism, about $ 3.3 billion), another 31.6% - transport services ($ 1.96 billion), 8.8% - telecommunications, computer and information services ($ 545.3 million), 3% - other business services.
Exports of industrial goods increased by 22.8% - $ 2.41 billion. Within this group, exports of textile yarn, fabrics and finished products amounted to $ 975.9 million (+ 20.7%), non-ferrous metals - $ 882 million (+ 12.7%), and products made of non-ferrous minerals - $ 175.2 million (+ 35.6%).
Exports of various manufactured goods almost doubled - from $700 million to $1.36 billion (+94.9%). In particular, the supply of clothing and accessories for clothing increased by 31.4% to $629.9 million.
The supply of machinery and transport equipment increased by 32.3% to $632.9 million. Exports of other transport equipment increased by 64.2%, energy-generating machinery - by 27.7%, and communication and sound recording equipment - by four times. At the same time, exports of cars decreased by 5.4%.
Exports of chemicals and similar products increased by 31.7% over the first half of the year to $1.28 billion.
The main part was accounted for by inorganic chemicals - $789.1 million (+45.5%). Fertilizer exports remained almost at the same level as last year - $207.8 million, while exports of primary plastics increased by 19.2% to $138.9 million.
Exports of food products and live animals increased by 9% to $1.32 billion, and their share in total exports increased from 7% to 8.3%.
In January-June, Uzbekistan exported 1.087 million tons of fruit and vegetable products - 0.8% more than a year earlier.
In monetary terms, exports of fruits and vegetables increased by 3% - from $847.1 million to $872.9 million. Their share in total exports was 5.5%.
At the same time, the indicators for individual types of products differed significantly. Fruit exports decreased in physical terms from 198.2 thousand tons to 158.5 thousand tons (–20%), and in monetary terms from 250.4 million dollars to 240.6 million dollars (–3.9%).
Cherry deliveries decreased from 71.9 million dollars to 59.9 million dollars (–16.7%), apricots – from 40.7 million dollars to 30.5 million dollars (–25.1%). At the same time, dried apricot exports increased from 13 million dollars to 25.2 million dollars (+93.8%).
Vegetable exports increased from 156.5 million dollars to 190.3 million dollars (+21.6%). In particular, onion exports increased from $73.7 million to $82.1 million (+11.4%), cabbage - from $48.5 million to $53.8 million (+10.9%), tomatoes - from $23.5 million to $33.8 million (+43.8%).
According to the results of the first six months, textile exports reached $1.6 billion, an increase of 24.1% compared to the same period last year.
Textiles accounted for 10.1% of total exports. The main share in its composition was occupied by finished textile products - 52.6% and yarn - 31.1%.
Uzbekistan's imports increased by 21% in January-June - from $20.78 billion to $25.15 billion.
Imports of goods increased by about $4 billion to $22.2 billion, while imports of services amounted to about $3 billion.
Machinery and transport equipment still remain the largest component of imports. Their deliveries increased by 25.1 percent to $8.25 billion, and their share in total imports increased from 31.8 percent to 32.8 percent.
Within this category, imports of automobiles and other transport equipment reached $2 billion (+31.7 percent). In particular, imports of passenger cars increased by 84.5 percent to $778.3 million, and imports of automotive parts and accessories increased by 12.7 percent to $904.3 million.
Imports of electrical machinery and equipment increased by 44.4 percent to $1.38 billion, energy-generating machinery by 56 percent to $839.7 million. Deliveries of telecommunications equipment almost doubled to $840.9 million.
Among the major categories, imports of food and live animals grew at the highest rate – by 44.2 percent to $2.82 billion. Their share in total imports increased from 9.4 percent to 11.2 percent.
Imports of cereals and cereal products increased by 67.3 percent to $761.1 million, meat and meat products – by 480.8 million (+42.1%), sugar, sugar products and honey – by 362.7 million (+48.6%).
Deliveries of vegetables and fruits increased to $325.7 million (+35.6%), dairy products and eggs - to $203.9 million (+38.8%).
Imports of mineral fuels, lubricating oils and similar materials increased by 19.3% to $2.23 billion.
In particular, imports of oil and oil products reached $1.11 billion (+8.1%), and imports of natural and artificial gas reached $971.7 million (+41.4%). Imports of propane increased by 3.6 times to $86.3 million.
Imports of gasoline increased by 78.5% to $409.5 million, while imports of diesel fuel decreased by 11.1% to $228.9 million.
Imports of electricity decreased by 15.6% to $55.1 million, while exports reached $116.2 million (+13.4%).