

55 trillion versus 35 trillion: G7 and BRICS economies compared
According to forecasts for 2026, the total nominal gross domestic product of the "Group of Seven" countries will reach 55.3 trillion dollars, while that of the 11 countries included in BRICS in the infographic will reach 35.2 trillion dollars. At this rate, the G7 economy is almost 1.6 times larger than that of BRICS.
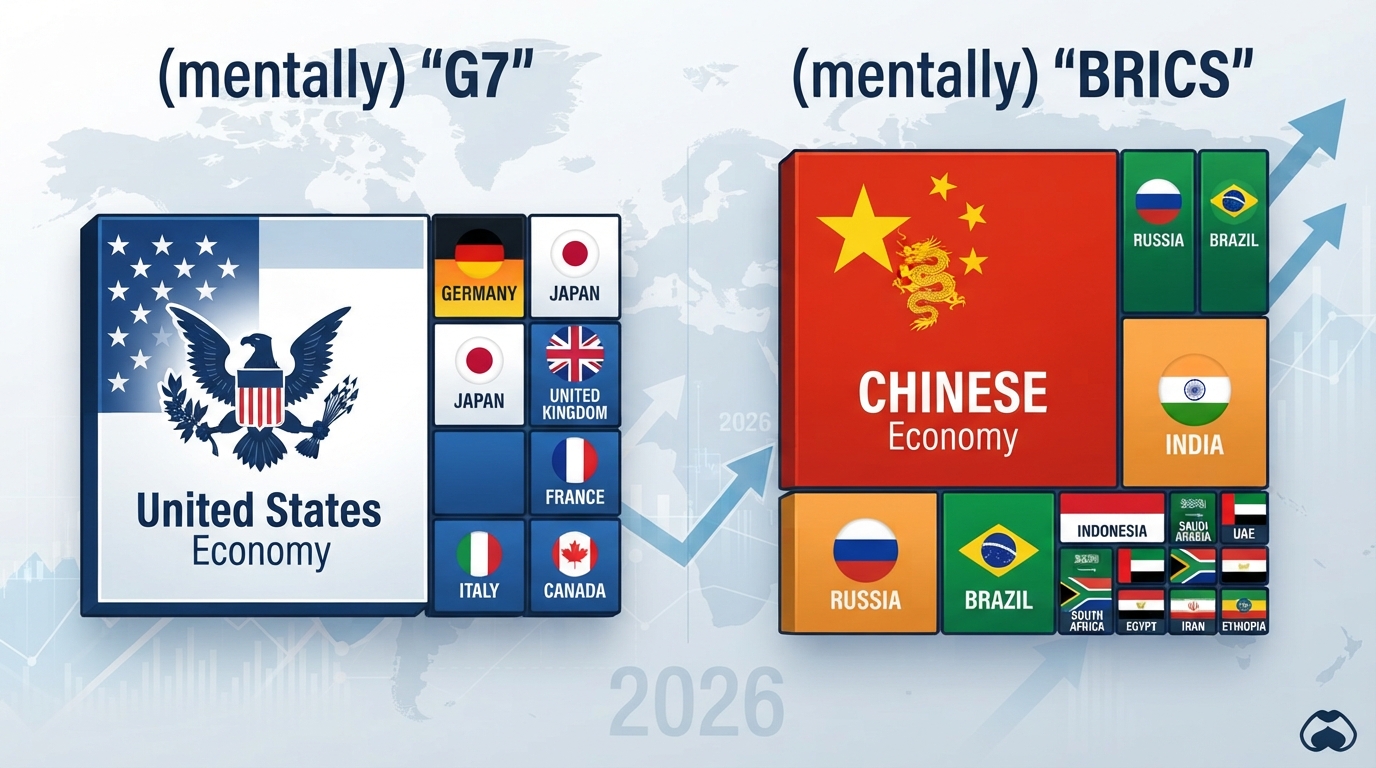
55 trillion against 35 trillion: G7 and BRICS economies compared
In the comparison, the size of the economies was assessed using nominal GDP expressed in US dollars and based on current prices.
According to the presented forecasts, in 2026 the size of the global economy will reach approximately 126.3 trillion dollars. Almost 44 percent of this accounts for the G7's share, while 28 percent belongs to the share of the BRICS countries in this calculation.
Within BRICS, China leads by a wide margin. The country's nominal GDP is expected to be around 20.85 trillion dollars. This constitutes nearly 60 percent of the total economic volume calculated for the association.
India holds second place — its GDP is estimated at approximately 4.15 trillion dollars. The figure for Russia and Brazil each stands at nearly 2.6 trillion dollars.
In the infographic, besides these four countries, Indonesia, Saudi Arabia, the United Arab Emirates, the Republic of South Africa, Egypt, Iran, and Ethiopia are also included in the BRICS calculation.
In the "Group of Seven," the dominance of the US is clearly visible. Its nominal GDP is projected to reach 32.38 trillion dollars in 2026. This constitutes nearly three-fifths of the G7's total economy.
After the US comes Germany — its economy is estimated at 5.45 trillion dollars. The following positions are occupied by Japan, the United Kingdom, France, Italy, and Canada.
However, when comparing economies by purchasing power parity, the result changes. This method takes into account price differences in countries: it considers how many goods and services the same amount of money allows one to purchase in different nations.
In such a calculation, the size of developing countries' economies usually appears larger. In particular, China is ahead of the US in GDP volume by purchasing power parity.
This infographic, however, specifically compares nominal GDP. For this reason, fluctuations in currency exchange rates can also significantly affect countries' economic volumes in dollars and their positions in the rankings.
The presented figures are forecasts, not the final results of 2026. Estimates may be revised as new data arrives.