

Uzbekistan’s trade deficit widens to $9.3bn as imports outpace exports
Uzbekistan's foreign trade turnover reached $41 billion in the first half of 2026, up $2.8 billion, or 7.4%, compared with the same period last year.
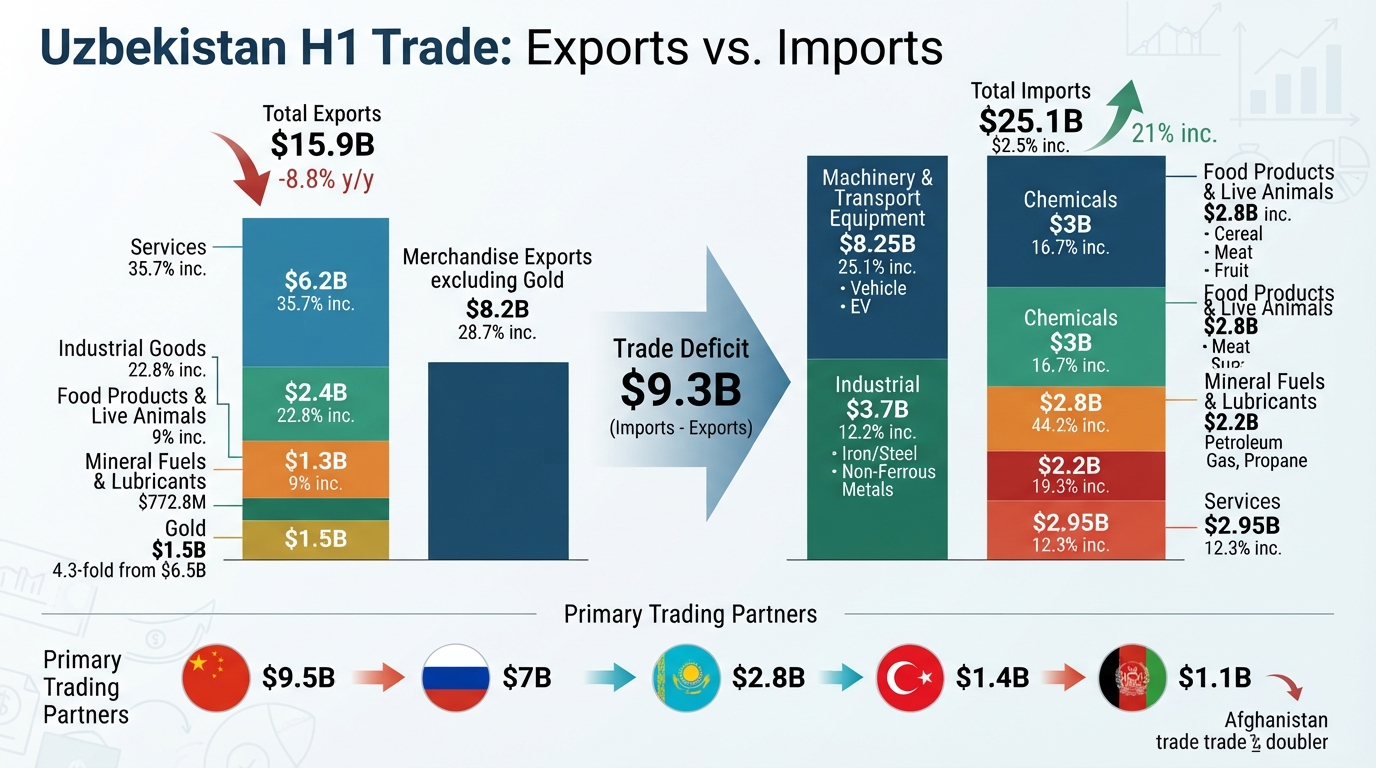
Uzbekistan's trade deficit expanded to $9.3 billion as imports outpaced exports, according to the National Statistics Committee. Despite an overall increase in trade, exports saw an 8.8% year-on-year decline, totaling $15.9 billion, while imports climbed 21% to $25.1 billion.
The committee highlighted that, excluding gold, merchandise exports actually increased by 28.7% from the previous year, reaching $8.2 billion.
China remained Uzbekistan's primary trading partner, with bilateral trade reaching $9.5 billion during the reporting period. Russia followed with $7 billion, then Kazakhstan with $2.8 billion, Turkey with $1.4 billion, and Afghanistan with $1.1 billion. Trade with Afghanistan demonstrated significant growth, more than doubling in two years, with bilateral trade totaling $458 million in the first half of 2024.
Services generated the largest share of export revenues, increasing by 35.7% to $6.2 billion. Tourism contributed $3.3 billion, and transport services brought in nearly $2 billion.
Industrial goods ranked as the second-largest export category, with revenues of $2.4 billion, a 22.8% increase. Textile products accounted for $975.9 million, and non-ferrous metals for $882 million.
Gold exports experienced a sharp decline, falling from $6.5 billion in the first six months of 2025 to $1.5 billion in the same period of 2026, indicating a 4.3-fold reduction in gold sales by the Central Bank.
Exports of food products and live animals rose 9% to $1.3 billion, with fruit and vegetable exports contributing $899.5 million and cereals and cereal preparations $299.1 million.
Mineral fuels and lubricants exports totaled $772.8 million. This included petroleum products at $422.2 million (up 154.3%), natural gas exports at $232.9 million (down 34.4%), and electricity exports at $116.2 million (up 13.4%).
On the import side, machinery and transport equipment remained the largest category, increasing 25.1% to $8.25 billion. Vehicle imports rose 31.7% to $2 billion, while imports of electric vehicles and related equipment surged 44.4% to $1.4 billion.
Industrial goods imports reached $3.7 billion, up 12.2%. Iron and steel imports increased 6.3% to $1.5 billion, and non-ferrous metal purchases soared 80.5% to $534.5 million.
Chemical imports rose 16.7% to $3 billion, including $966.4 million in medical and pharmaceutical products.
Imports of food products and live animals saw one of the fastest growth rates, increasing 44.2% to $2.8 billion. Cereal and cereal preparation imports rose 67.3% to $761.1 million, meat and meat products increased 42.1% to $480.8 million, sugar, sugar products, and honey imports climbed 48.6% to $362.7 million, and fruit and vegetable imports rose 35.6% to $325.7 million.
Imports of mineral fuels and lubricants increased 19.3% to $2.2 billion in the first half of the year. Petroleum and petroleum products accounted for $1.1 billion of this total. Gasoline imports rose 78.5% to $409.5 million, and diesel imports increased 11.1% to $228.9 million.
Natural gas imports also saw a significant rise, reaching $971.7 million, up 41.4% from the previous year. Propane imports increased 3.6-fold to $86.3 million.
Meanwhile, service imports grew 12.3% to $2.95 billion. Tourism-related services accounted for $1.3 billion (43.8% of total service imports), and transport services made up $812.9 million (27.5% of the total).