

Uzbekistan is growing faster than Kazakhstan, but the gap has not narrowed — World Bank on per capita income
Growth rate in Uzbekistan is higher than in Kazakhstan, but the gap has not decreased — World Bank on per capita income
The World Bank has released a new report analyzing the economic indicators of Central Asia. It notes that by the end of 2025, per capita income in Kazakhstan and Turkmenistan is above average. Meanwhile, Uzbekistan, Kyrgyzstan, and Tajikistan remain among the lower-middle-income countries for now.
At the same time, World Bank experts concluded that all five countries in the region have moved up at least one tier over the past 20 years.
Every year, the World Bank classifies the world's economies into four income groups based on gross national income (GNI) per capita. However, this indicator should not be confused with the average wage or the real disposable income of the country's population. What is meant here is the gross national income of the economy per capita.
The organization uses the Atlas method to compare countries. This method helps prevent sharp fluctuations in exchange rates from overly affecting the result.
When converting GNI from national currency to US dollars, the exchange rates of the current year and the preceding two years are taken into account. In addition, the difference between domestic inflation in the country and international inflation is not ignored. After that, the GNI in dollar terms is divided by the mid-year population.
As a result, a sharp short-term depreciation or appreciation of the national currency does not directly and drastically affect the country's position in international rankings.
Thresholds for income groups
As of 2025, the World Bank has classified countries into the following groups based on income levels:
- up to $1.2 thousand — low-income;
- from $1.2 thousand to $4.6 thousand — lower-middle-income;
- from $4.6 thousand to $14.4 thousand — upper-middle-income;
- above $14.4 thousand — high-income.
However, the above thresholds are not fixed. The World Bank reviews them annually, taking into account the level of international inflation. Therefore, even if a country's gross national income indicators increase, this does not guarantee its transition to a higher group.
Highest and lowest indicators in the world
According to calculations based on the Atlas method, in 2025, the average global per capita income was $14.2 thousand. In this list, the highest indicator belonged to Switzerland with $110.3 thousand. The next positions were occupied by Norway ($97.3 thousand), Luxembourg ($95.7 thousand), Iceland ($89.2 thousand), and the USA ($88.8 thousand).
The top ten countries with the highest indicators also included Ireland, Singapore, Denmark, Qatar, and the Netherlands. Notably, seven of the ten countries with the highest per capita income are located in Europe. At the bottom of the list, the situation is completely different.
In Liberia and Sierra Leone, GNI per capita was $830, in Niger $750, in the Democratic Republic of the Congo $720, and in Somalia $640. According to data, even lower indicators were recorded in Malawi, Mozambique, the Central African Republic, Madagascar, and Burundi. Ten of the 11 countries at the very bottom of this list belong to the African continent.
Six countries moved to a higher income group
According to the latest World Bank report, six countries moved to a higher income group at the same time. Notably, no country fell into a lower group. Jordan, Micronesia, the Philippines, Sri Lanka, and Vietnam rose from the lower-middle-income group to the upper-middle-income group. Togo moved from the low-income group to the lower-middle-income group. These changes are explained by various reasons.
In Vietnam, rapid economic growth, particularly in exports, was one of the main factors. In Jordan, the revision of national accounts played an important role. In Togo, after population data was updated, significant changes occurred in per capita GNI indicators.
Analyses showed that the long-term trend is shaping up in a positive direction. According to World Bank data, since 1987, the share of low-income countries in the global economy has decreased from nearly 30 percent to 11 percent.
The situation in Central Asia
All five countries of the region were also classified according to the 2025 indicators. According to this, the highest result in terms of GNI was recorded in Kazakhstan with $13.7 thousand. The next positions were occupied by Turkmenistan ($6.3 thousand), Uzbekistan ($3.7 thousand), Kyrgyzstan ($2.8 thousand), and Tajikistan ($2.1 thousand).
In terms of income groups, a two-fold picture was observed among the countries of the region. Kazakhstan and Turkmenistan entered the group of upper-middle-income countries. Uzbekistan, Kyrgyzstan, and Tajikistan remain among the lower-middle-income countries.
Central Asia moved up one tier: it took 20 years
If the region's current economic situation is compared with the situation 20 years ago, an even more interesting picture emerges. For example, in 2005, Kazakhstan and Turkmenistan were in the lower-middle-income group. Uzbekistan, Kyrgyzstan, and Tajikistan were among the low-income countries at that time.
Twenty years later, Kazakhstan and Turkmenistan joined the ranks of upper-middle-income countries. Uzbekistan, Kyrgyzstan, and Tajikistan rose to the lower-middle-income group. Thus, in the period from 2005 to 2025, all five countries of Central Asia moved up one tier according to the World Bank classification.
Kazakhstan — the region's largest economy
In addition to per capita income, Kazakhstan remains the clear leader in Central Asia in terms of the overall size of the economy. According to World Bank data, the country's GDP was $306.2 billion. In neighboring Uzbekistan, this indicator was $147 billion. (By the end of this year, it is expected to reach $167–180 billion).
In the remaining countries:
Turkmenistan — $49.8 billion;
Kyrgyzstan — $22.6 billion;
Tajikistan — $17.7 billion.
The total GDP of all five countries was approximately $543.4 billion. Kazakhstan accounted for 56.4 percent of it. Combined with Uzbekistan, these two generated 83.4 percent of the total GDP. These figures show the place of Astana and Tashkent in the region's economy.
Uzbekistan is growing fast, but the gap is not narrowing
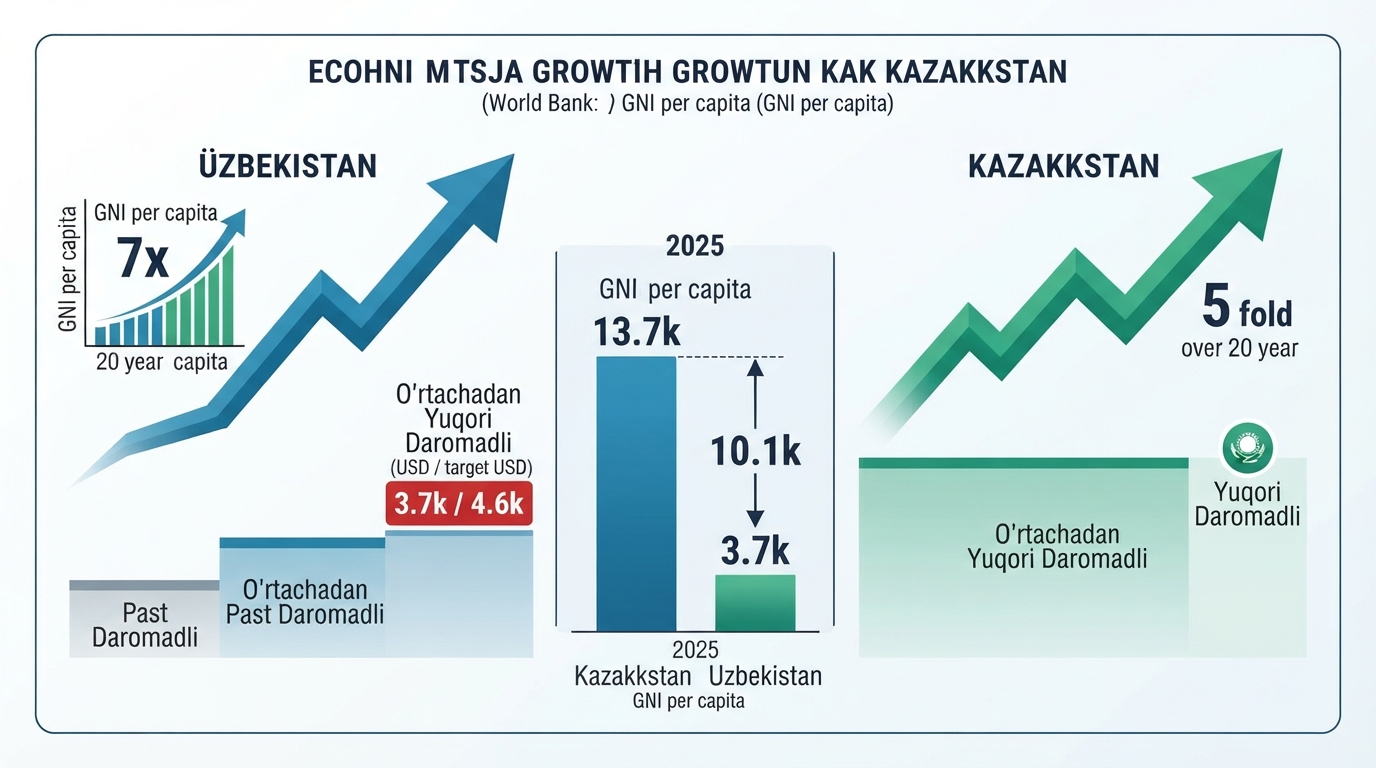
The economic gap between Kazakhstan and Uzbekistan, when viewed from the perspective of gross national income per capita, appears even more serious. In 2005, GNI per capita in Kazakhstan was $2.8 thousand, and in Uzbekistan, it was $520. Over the past 20 years, Astana managed to increase this indicator by 5 times, and Tashkent by 7 times. However, in terms of overall indicators, Kazakhstan still holds a large advantage.
If we look at the situation over the last 10 years, a slightly different picture emerges. Compared to 2015, GNI per capita increased by 24.5 percent in Kazakhstan and by 15.8 percent in Uzbekistan. Some experts explain this by the fact that Tashkent carried out a currency reform in 2017, as a result of which the income indicator calculated in dollars at the official rate was artificially lowered.
But in the last five years, the situation changed again. Compared to 2020, GNI per capita increased by 64 percent in Kazakhstan and by 75.6 percent in Uzbekistan. It follows that in the last five-year period, Uzbekistan recorded a higher growth rate than Kazakhstan. In particular, in 2025, Kazakhstan achieved a 13.6 percent growth in GNI per capita, while Uzbekistan achieved a 15.8 percent growth.
However, this does not mean that the absolute gap with Kazakhstan has narrowed. On the contrary, the difference between the two countries increased from $8.9 thousand in 2024 to $10.1 thousand in 2025. As a result, in 2025, the per capita income of Kazakhstanis was $13.7 thousand, and that of Uzbeks was $3.7 thousand. That is, the indicator in Kazakhstan is almost 3.7 times higher than in Uzbekistan. This situation, which at first glance seems like a misunderstanding, can be explained by the fact that Kazakhstan's economy is growing from a larger base, and moreover, the population in Uzbekistan is growing faster than in its neighbor.
The next target for Uzbekistan — the group of upper-middle-income countries
The data published by the World Bank shows that Uzbekistan has been experiencing significant economic growth in recent years. In 20 years, the country increased its GNI per capita by 7 times, rising from the status of a low-income country to the group of lower-middle-income countries.
Now the next important stage for the country is to enter the group of upper-middle-income countries. For this, GNI per capita must exceed the current threshold of $4.6 thousand. The current indicator is $3.7 thousand.
Therefore, if today's thresholds remain unchanged, Uzbekistan needs to increase its GNI per capita by at least another $900 to move to the next income group. However, it is also necessary to take into account that this threshold may change in the coming years. The World Bank updates the thresholds of income groups every year based on international inflation.
What will determine the region's next direction?
In general, the World Bank's 2025 data shows that economic growth continues in Central Asia. All five countries have moved up one tier in the income classification over the past 20 years.
Kazakhstan maintains its leadership in both the overall size of the economy and GNI per capita. The country has come very close to the threshold of transitioning to the group of high-income countries. Uzbekistan, on the other hand, recorded a higher growth rate than Kazakhstan in the last five years and in 2025 itself. Nevertheless, the gap in GNI per capita between the two countries increased again in 2025.
Therefore, the main issue for Uzbekistan remains not only rapid economic growth, but also increasing per capita income at a stable and long-term pace. Whether the distance between Kazakhstan and Uzbekistan will narrow or, on the contrary, persist in the coming years depends primarily on how stable the income growth will be in both countries.