

Production in Uzbekistan's free economic zones increased by 21% in six months.
The State Statistics Committee of Uzbekistan reported that industrial production in the FEZ reached 32,060.5 billion soums in January-June 2026, an increase of 21%.
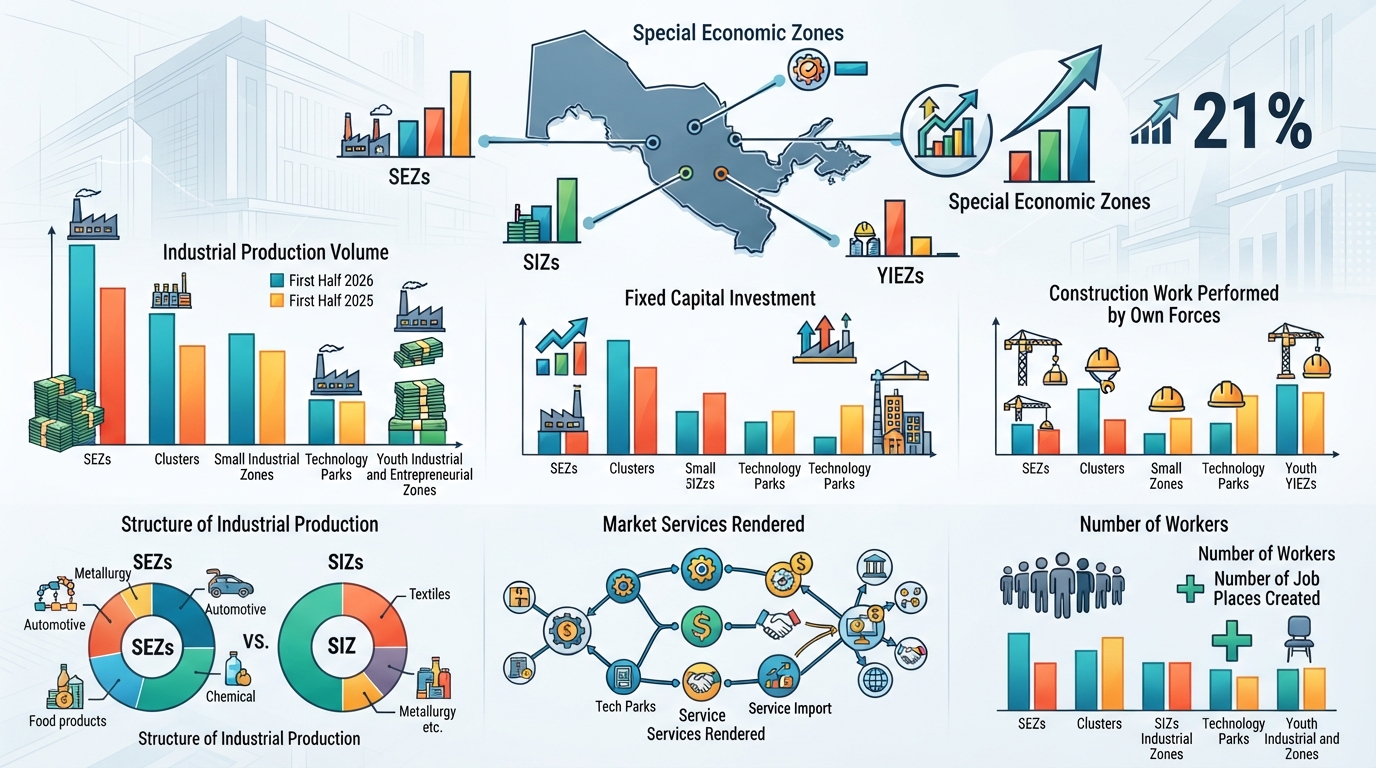
Production in Uzbekistan's special economic zones increased by 21% in the first half of the year.
Tashkent, Uzbekistan (UzDaily.uz) —
According to the National Statistics Committee of the Republic of Uzbekistan, industrial output of enterprises located in Uzbekistan's special economic zones (SEZs) reached 32,060.5 billion soums for the period from January to June 2026. This figure is the highest among all types of economic zones in the country and represents a 21.0% increase compared to the same period the previous year, when it reached 26,504.1 billion soums.
As of July 1, 2026, 34 special economic zones, 400 small industrial zones, 27 technology parks, 354 clusters, and 163 youth industrial and entrepreneurship zones (YIEZs), including enterprises with participant status, were operating in Uzbekistan. There were 1,167 such enterprises in the SEZ, 3,187 in small industrial zones, 4,302 in technology parks, 384 in clusters, and 1,289 in small industrial zones.
In addition to the SEZ, industrial production during the reporting period amounted to 10,062.2 billion soums in small industrial zones, 19,235.3 billion soums in clusters, 1,632.6 billion soums in technology parks, and 491.7 billion soums in small industrial zones. For comparison, in January-June 2025, these figures were 8,823.1 billion soums in small industrial zones, 16,701.0 billion soums in clusters, and 1,011.2 billion soums in technology parks.
Fixed capital investments from all funding sources were also highest in the SEZs, reaching 5,116.5 billion soums. This figure was 1,633.2 billion soums in clusters, 808.9 billion soums in technology parks, 551.8 billion soums in small industrial zones, and 1.4 billion soums in small industrial zones. Moreover, in terms of the volume of construction work performed internally, small industrial zones led with 527.3 billion soums, while this figure was 153.5 billion soums in technology parks, 93.9 billion soums in the SEZs, 63.3 billion soums in small industrial zones, and 22.5 billion soums in clusters.
Technology park enterprises provided the largest volume of market services – 19,085.8 billion soums. In the FEZs, this figure amounted to 1,161.7 billion soums, in clusters – 711.3 billion soums, in industrial zones – 707.9 billion soums, and in industrial zones – 159.4 billion soums. Technology parks also led in service exports with USD 392,980.9 thousand, significantly outpacing the FEZs (USD 4,151.1 thousand), industrial zones (USD 1,049.4 thousand), and industrial zones (USD 1,650.5 thousand); data on cluster service exports is not presented in the report. In terms of service imports, technology parks also ranked first with USD 164,403,500, followed by FEZs (USD 55,371,200), small industrial zones (USD 15,621,500), small industrial zones (USD 196,500), and clusters (USD 228,800).
At the end of the reporting period, the number of employees at participating enterprises was: 60,830 in FEZs, 62,137 in technology parks, 50,362 in clusters, 43,611 in small industrial zones, and 6,507 in small industrial zones. The number of jobs at the same time reached 61,210 in FEZs, 65,841 in technology parks, 51,775 in clusters, 44,028 in small industrial zones, and 6,527 in small industrial zones.
The Committee also provided separate data on IT Park participants: for January-June 2026, the volume of their service exports reached USD 392.5 million, up from USD 302.2 million the year before. Service imports totaled USD 160.1 million, compared to USD 104.2 million for the same period in 2025.
The volume of market services by IT Park participants increased to 18,166.4 billion soums from 14,054.6 billion soums, an increase of 4,111.8 billion soums. Investments in fixed assets reached 647.5 billion soums, up from 295.5 billion soums the year before, an increase of 352.0 billion soums. The number of jobs at IT Park participants at the end of the period increased to 51,991 from 43,070 the year before.
In the industrial production structure of enterprises within the SEZ, the largest shares by type of activity are held by the metallurgical industry (24.4%) and the production of motor vehicles, trailers, and semi-trailers (24.1%). They are followed by food production (9.3%), other non-metallic mineral products (7.5%), chemical production (5.9%), rubber and plastic products (5.4%), and textiles (4.6%); other activities account for 18.8%.
In small industrial zones, the structure is different: textile production leads (19.0%), followed by the metallurgical industry (17.5%), coke and petroleum product production (13.0%), clothing production (9.4%), food production (7.9%), rubber and plastic products (6.8%), and electrical equipment production (3.7%); the share of other activities is 22.7%.
According to the committee's methodological explanations, a special economic zone is an area with defined boundaries and a special legal regime, created to attract investment, technology, and management expertise for the accelerated development of a region. A small industrial zone is a plot of land or production space equipped with utilities. A technology park is a form of integration of scientific, educational, financial, and business structures for innovative activities. Clusters are created to organize the production and advanced processing of fruit and vegetable and agricultural products, as well as to develop livestock and fish farming complexes. Youth industrial and entrepreneurial zones are designed to provide employment for young people and support their entrepreneurial initiatives.